

(This actually took place in late January, but it’s taken me this long to get it together enough to post)
I was pretty excited about the Metabolic Efficiency Test. Running can be many things, but most often it is a mix of sweat, sensation and inner dialogue. This was a rare opportunity to have something empirical to obsess over (perhaps “obsess” is too strong a word – “geek-out” is more accurate).
The test was performed at Ryerson University’s Nutrition and Exercise Testing (NEXT) Lab in the heart of downtown Toronto. For those who don’t know what the test entails, there are four quantitative metrics: heart rate, pace, how much oxygen you consume and how much carbon dioxide you produce. There is also one subjective measurement, ‘perception of effort’ which is a scale of 1-20, where 1 is ‘I’m asleep’ and 20 is ‘I’m about to die.’
To measure your respiration gases, you are hooked up to a metabolic cart and forced to breathe through a tube. Then you strap on a heart rate monitor and run on a treadmill (or ride a stationary bike). The test is similar to a V02 Max test, but unlike V02 Max, the key information of the test is measured when you are performing exercise at sub-maximal levels. Based on the ratio of oxygen consumption to carbon dioxide production, you can get a measurement of your substrate utilization at any given effort. In other words, it can tell how much fat and how much carbohydrate your body is using as fuel.
So you put a mouthpiece that is kind of like a snorkel in your mouth and your nose is sealed with a nose clip. The breathing contraption is supported by a rigid harness you wear on your head to prevent it from bouncing around (which is surprisingly effective), and the tube is held above and to the side by a metal arm. All-in-all, it is not too uncomfortable. The lab technicians would start the treadmill at a walking pace, 3.5 mph at 1% grade, and after a warm-up period, increase it on regular intervals by .5 mph at a time. The ME test would end when I reached the point when I was using only CHO (carbohydrates) as fuel. As a bonus, after the ME test ended, they were going to let me max out and measure my V02 peak (not a true V02 max test, but pretty close).
The test was pretty relaxed for the first while, moving from a walk to a fast-walk to a slow jog, though I hit an awkward point when I didn’t know whether to walk or run. This resulted in walking for a sustained period much quicker than I would ever normally walk and this was strangely taxing. Once I was running, it was much easier. I could see my heart rate on the treadmill and could see it increase and level off with each stage. At each speed increase I was asked to point at a number on a chart which represented my perceived effort.

Because I’d been training by heart rate for the last year, I could pretty much tell how my body was going to react to the increasing paces and when discomfort was going to set in. I also had a pretty good idea of my max heart rate (about 180). When the pace got to about 7.5 mph, my heart rate was in the high 160’s and I knew I was starting to enter the unsustainable zone. How many more stages could I take? At this point, the equipment started to seem like an impediment. I felt like I could not take in enough air and my mouth and throat had gotten really dry. I had the urge to rip off the nose clip or stick my fingers in beside the mouth piece to let in more air, but I was paying for this test, so best not to screw it up. About half way through the next stage, with my heart rate in the 170’s Julia, who was manning the MET cart monitor said: “you are almost at the point where you are burning 100% carbs…” I was a little surprised that it had taken as long to get to that point.
Now it was time to start watching the clock. They say the mind always quits before the body, and I absolutely agree, because at 8.5 mph and 5% grade, I already knew I was close to quitting. My heart rate was at 182 so rationally, I knew I was maxed… but I had to get through the stage. The treadmill ticked up once more, I ran for a few more seconds, and then I was done.
A couple observations at this point, before I get to the results:
- I would never choose to run on the tread mill – this is definitely not why I run. I can understand that for those who like to control all the variables, who like to plug themselves in and maybe lose themselves, running in place might have an appeal. But for me a huge part of why I run is movement, specifically, movement through space. The other appealing element of running that the treadmill takes away is the interaction with the environment, especially on a trail. Further, not that this is of any consequence, the pace on the treadmill always seems off. I have run with a heart rate monitor long enough to know what may average paces are at various heart rates, and the treadmill measured significantly slower than reality. Not sure why – doesn’t really matter.
- As I said before, the mind always quits before the body. To measure my V02 peak or max, I was supposed to go to the point where I couldn’t go any more – I’m not even sure that this is possible. I know for me, my rational brain stops me well before my body is done. In this case, I could see my heart rate, I knew I was maxed, and I also knew how long the next interval was going to be. I decided I would make it to the next stage and then quit – not fully consciously, but I was pretty sure. Could I have gone longer? Most definitely. If I knew the stage was going to last a minute longer than it did, could I have lasted? Probably. Anyway, there is probably a lesson in here for the future.
The results:
Given my diet and the way I had been training for more than a year I was hoping to see that my body was adapting to fat metabolism. You can’t really know without “looking under the hood” but anecdotally, I had definitely experienced some changes – I knew I was able to run for a lot longer than I used to without having to eat. And my daily energy levels seemed much more even – I didn’t get “hangry” any more.
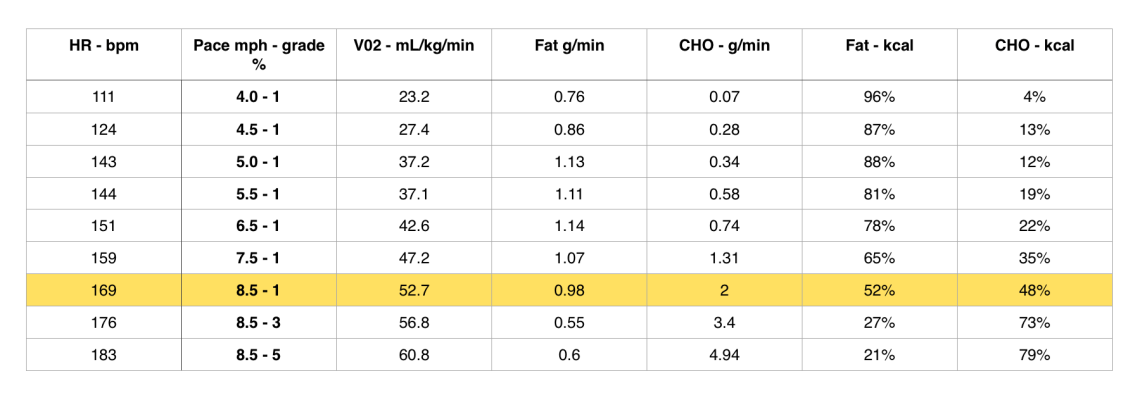
The results showed that I utilize a high percentage of fat-to-carbs at lower to mid-intensities and don’t start relying heavily on carbohydrates until a pretty high level of effort. For more than a year, I had been training almost exclusively using the Maffetone Method. Phil Maffetone’s basic formula for maximum aerobic heart rate is 180 minus your age. In my case, this is 135, which I modified to 140 based on my training and physical history. The test showed that at this level, I am burning 80 – 90% fat calories. During training, I would slow down or walk if my heart rate crept up to 150. At this range, I am still getting over 75% of my energy from fat.
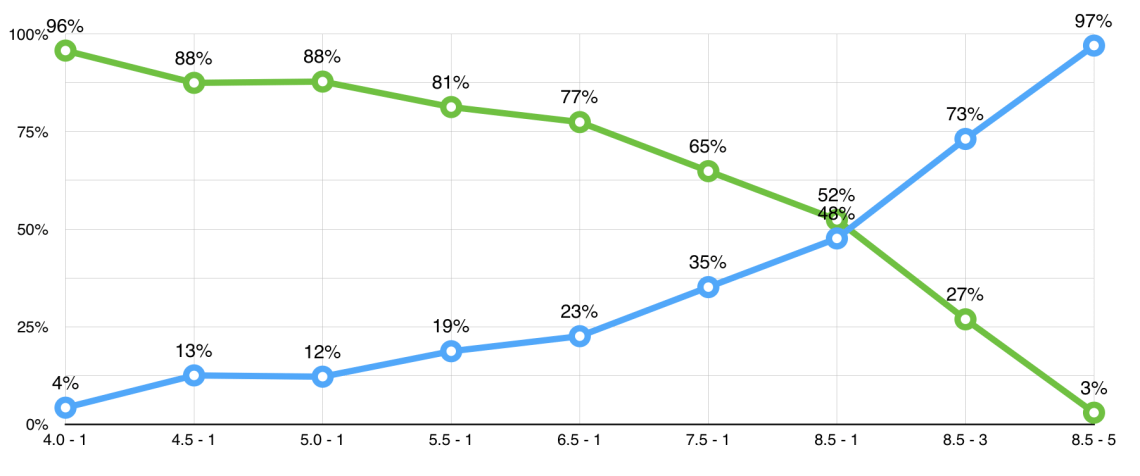
My Metabolic Crossover Point (MCP) occurred at about 170 ppm. This was the point where my energy was being derived from a 50/50 mix of fat and carbs, and the point after which I would start to use primarily carbs for fuel. It is also referred to by some as the “Metabolic Efficiency Point” as below this level, you using more fat than carbs.
As a percentage of V02 max (peak) my MCP occurred at about 87% which was really surprising. To put this in perspective, I can only get my heart rate above 170 with some hard intervals or hill repeats. A sustained climb will get me into the 160’s and the 170’s are not sustainable for any length of time.
Some other interesting points:
– My “Fat Max” point occurred at 151 bpm. This is the point when I was burning the most fat (vs. the highest percentage)
- At the Fat Max point, I was burning 1.14 grams per minute. For decades, conventional wisdom was that the maximum fat a human could burn was 1 g/min. Obviously this is false and more recent studies have shown that people have achieved closer to 2 g/min.
- My V02 max (peak) was 60.9 which is defined as “Superior”. Higher than I would have guessed at age 45. Damnit, now I really don’t have any excuses.
So what does it all mean? Well, on one hand, nothing. Empirically, the data paints a pretty positive picture as it relates to endurance running and the effects of my training and diet so far. It suggests that I have a decent sized engine, and am pretty fat-adapted: that I should be able to run at moderately-high intensity without burning through my glycogen stores too quickly and run at moderately-low intensity for a long time without a ton of fuel input and likely, without bonking. Ultimately though, it is just numbers on paper. It says nothing about pace or the ability of my skeletal muscles to handle the repetitive stress and various strains of extended efforts and different types of terrain, nor does it say anything about running economy. It doesn’t necessarily mean I will be able to run faster, longer or farther.
So what good is it? At its most basic, it’s information about effort as it relates to metabolism and fuelling.
Here’s what I think I need to focus on in training, and this hasn’t really changed:
- Specificity of training
- Running economy
- Mileage
These are all big topics and maybe I’ll elaborate on them another time.
Additionally, what it does provide me with is:
Confidence:
It’s given me more faith in the process, and more confidence in what I am capable of. It’s not that I am not a confident person, but “endurance athlete” wasn’t part of the self-image that I’d built for myself, well, ever. From a body-type perspective, I’d always thought of myself more sprinter than marathoner, more table than lawn tennis. I think despite our best efforts, we start labeling and categorizing ourselves, probably as soon as we are aware that labels and categories exist. And even now that I am old and experienced enough to know that labels are artificial, it is hard not to let them affect my behaviour on some level.
Also, confidence about race strategy. The data gives me some guidelines for how much food I will need to consume during a long race, and what impact different heart rate paces will have on my need to intake sugar.
Training Zone Information:
Though I still plan on running mostly at or below my aerobic threshold, I now know what impact dipping into higher heart rates has on my substrate utilization. I know that pushing into the 150’s is not going to rapidly deplete muscle glycogen stores, so I won’t be as hesitant to venture there for periods.
Data:
Despite the current array of available gadgets, running is something we experience largely by feel. And unless we are planning to tow along a mobile lab behind us, it will remain that way (though given the current tech trajectory, who knows?) Personally, I prefer it this way – we are people, after all, not cyborgs. Why run after all, if not to experience, to feel, to be alive!?
This being said, a little bit of data can help us better understand ourselves and how and why our bodies do some of the things they do, as a result of or despite our efforts. And it’s nice to have a little bit of empirical confirmation of what you feel.
Here are some other people’s experiences with Metabolic Efficiency Testing that I found helpful:
Andrew Skurka:
http://andrewskurka.com/2015/metabolic-efficiency-test-results-hiking-running/
Tawnee Prazak, Endurance Planet:

1 Comment